Cloud and Aerosol Observations at Tokyo Skyree
Outline
Cloud and Aerosol Observations at Tokyo Skytree have begun since June 2016 under the collaborative research among National Research Institute for Earth Science and Disaster Resilience (NIED), National Institute of Polar Research (NIPR) and Tokyo University of Science (TUS). The purpose of the joint research is to elucidate the characteristics of aerosols and clouds over Tokyo by in-situ observations.
Cloud droplet size distribution
Instruments
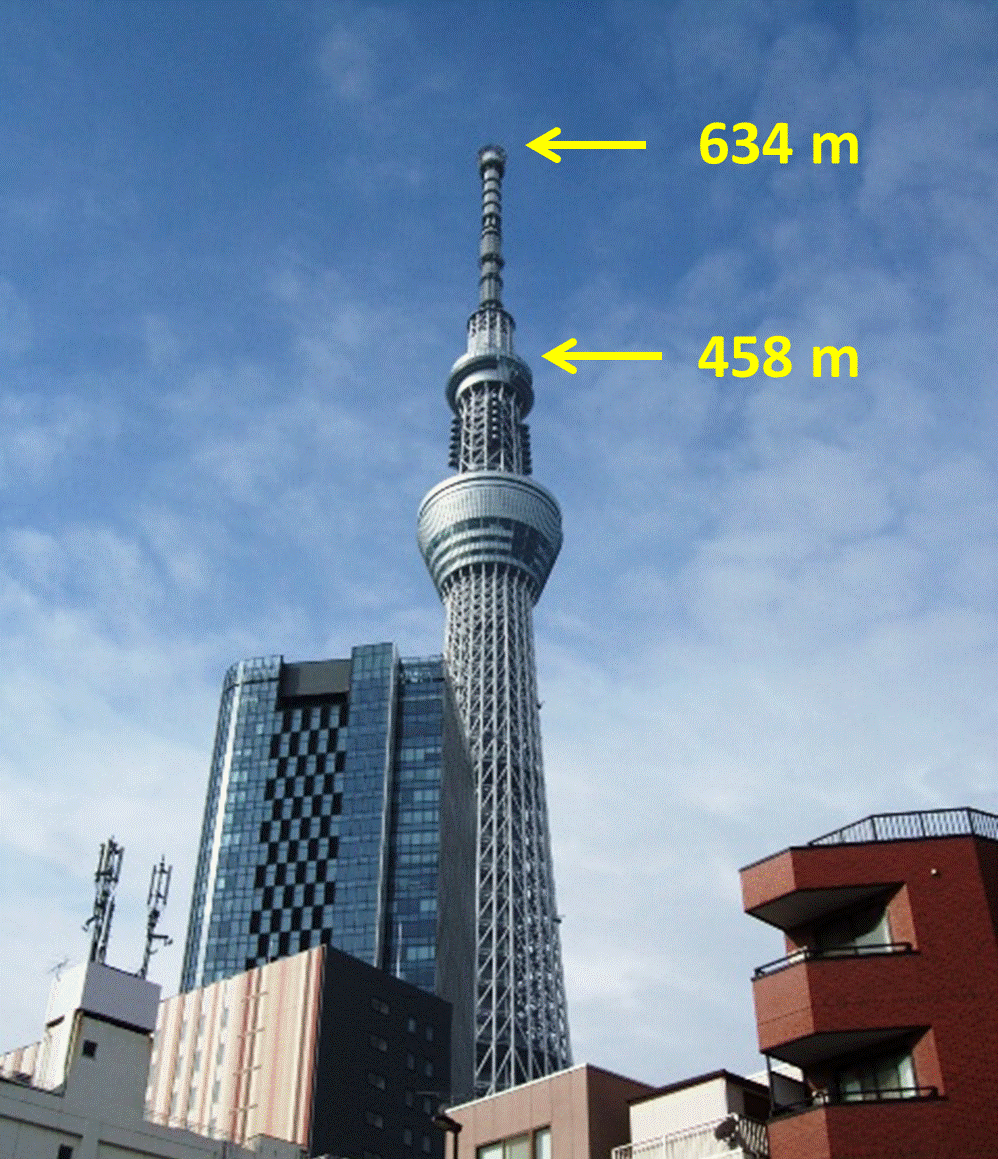
The cloud droplet size distributions are observed by a Fog Monitor (FM-120) manufactured by Droplet Measurement Technologies, Inc. This instrument is a kind of forward scattering spectrometer probe (FSSP) using a laser beam with a wavelength of 0.658 µm. An attached pump sucks ambient air at a rate of 1 m3min-1 and measures the droplet number concentration across 30 intervals for diameters from 2 to 50 µm using the forward scattering intensity of droplets. The Fog Monitor was installed on the western side of Tokyo Skytree at a height of 458 m (35.71°N, 139.81°E). The inlet of the Fog Monitor is fixed horizontally to face westward. Observations are taken every second and averaged across one-minute intervals for the analysis.
To detect drizzle particles, a Meteorological Particle Spectrometer (MPS) manufactured by Droplet Measurement Technologies Inc. was installed in the same location as the Fog Monitor. The MPS measures the diameter and the number of particles falling through a laser sheet with a width of 3.1 mm. The detectable particle size is between 50 μm and 3.1 mm in 50-μm intervals. In order to minimize the effects of the ambient wind on the measurement of particle numbers, the instrument was originally installed on a turn table attached to a wind vane to keep the laser sheet parallel to the wind direction. However, we removed the wind vane in our observations and fixed the laser sheet in a north-south orientation because of the restrictions of the observation site. Thus, the number concentration of drizzle particles measured by the MPS in this study could include large errors under windy conditions. Therefore, we used the MPS data only to determine whether there were drizzle particles at the observation site, and not for estimating the DSD.
As another way to detect drizzle particles, we used the radar reflectivity derived from the Ka-band radar belonging to NIED. It is a scanning Doppler radar with a wavelength of 8.6 mm and a beam width of 0.3°, and the maximum range for the observation distance is 30 km. The Ka-band radar was installed approximately 15 km south of Tokyo Skytree. From the Ka-band radar, the observation site at Tokyo Skytree is located at an azimuth of 11.3° and an elevation angle of 1.6° with a range 14.4 km.
Dataset
2016_skytree_FM.zip(162)
Data format
The CSV (Comma-Separated Values) file compressed as the Zip format.
Time period covered by the data
Start: 10:27 JST (Japan Standard Time; UTC + 9 hours) on 3 June 2016
End: 23:59 JST on 31 December 2016
Temporal characteristics of the data
Data have been averaged across one minute from original 1-second data.
Physical location of the measurement
Latitude: 35.7101°N
Longitude: 139.8107°E
Elevation: 458 m above ground level (460 m above sea level)
Sensor
Fog Monitor (FM-120) manufactured by Droplet Measurement Technologies, Inc.
Platform
On the western side of the Tokyo Skytree at the 458 m above ground level. The inlet of Fog Monitor is directed horizontally to the west direction.
Data contents
| Data | Description |
|---|---|
| Date | Year-Month-Day |
| Time | Hour: Minute: Second - in the Japan Standard Time (UTC + 9 hours) |
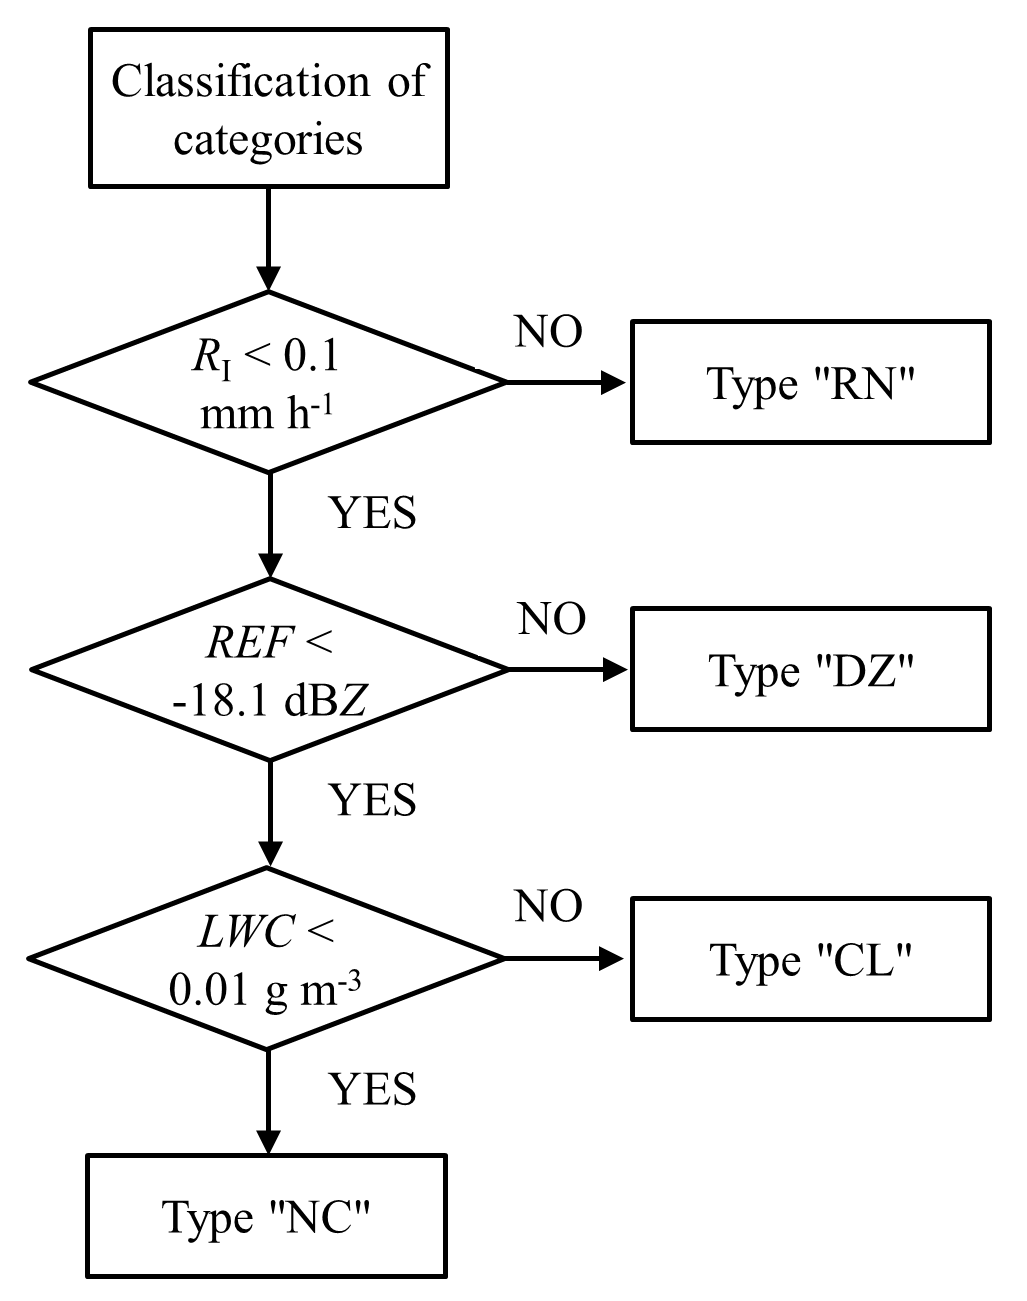
| Category | Categories of weather conditions. RN: Rainfall stronger than 0.1 mm/h. DZ: Drizzling. CL: Non-drizzling clouds. NC: No cloud. UC: Unclassifiable because of instrument troubles. Please see below for details. |
| Nc | Number concentration of cloud droplets smaller than 50 µm in diameter. Unit is cm-3. The value -99 indicates data missing. |
| LWC | Liquid water content of cloud droplet smaller than 50 µm in diameter. Unit is g m-3. The value -99 indicates data missing. |
| N1 - N30 | Number concentration of cloud droplets in each size bin. Units are cm-3. The value -99 indicates data missing. See the following table about the droplet diameter at each size bin. |
Classification of categories
We classified all droplet size distribution data into five categories: “RN” when it rained, “DZ” when it drizzled, “CL” for non-raining and non-drizzling clouds, “NC” for no clouds and “UC” for unclassifiable due to missing data. A flowchart below shows the classification process. When the rainfall intensity derived from the XRAIN was greater than 0.1 mm h-1, we classified the data as “RN”. Otherwise, when the radar reflectivity derived from the MPS or the Ka-band radar was greater than -18.1 dBZ, we classified the data as “DZ”. Here the threshold value of -18.1 dBZ corresponds to the situation when one droplet with a diameter of 50 μm exists in a volume of 1 cm-3. A droplet diameter of 50 μm is widely used as a threshold for drizzling clouds. The radar reflectivity used for the threshold for detecting drizzle was calculated from the MPS data or the Ka-band radar data. The ability to detect drizzle particles was compared when both the MPS and the Ka-band radar were available. Only 4.2% of the results were different between the MPS and the Ka-band radar. Therefore, we consider that they have an approximately equivalent accuracy for drizzle detection. Even when there were no clouds at the observation site, the Fog Monitor sometimes identified large aerosol particles as cloud droplets. In order to remove such noise, we classified the data as “CL” only when the liquid water content (LWC) was >0.01 g m-3 in non-drizzling and non-raining clouds. Otherwise the data were classified as “NC”. When we could not classify the data due to missing values, the data were labeled as “UC”.

Droplet diameter at each bin
Droplet diameters at the size bins of FM-120 are as follows.
| Bin number | Average diameter (µm) |
|---|---|
| 1 | 2.5 |
| 2 | 3.5 |
| 3 | 4.5 |
| 4 | 5.5 |
| 5 | 6.5 |
| 6 | 7.5 |
| 7 | 8.5 |
| 8 | 9.5 |
| 9 | 10.5 |
| 10 | 11.5 |
| 11 | 12.5 |
| 12 | 13.5 |
| 13 | 15 |
| 14 | 17 |
| 15 | 19 |
| 16 | 21 |
| 17 | 23 |
| 18 | 25 |
| 19 | 27 |
| 20 | 29 |
| 21 | 31 |
| 22 | 33 |
| 23 | 35 |
| 24 | 37 |
| 25 | 39 |
| 26 | 41 |
| 27 | 43 |
| 28 | 45 |
| 29 | 47 |
| 30 | 49 |
Data policy
- The data is available only for scientific purpose.
- NIED reserves the copyrights for the data. We strictly prohibit any re-distribution of the data in any manner.
- NIED and its staff members have no responsibility whatsoever for any direct or indirect damage or loss that may result from the usage of the data and the materials provided by this website.
- When you use the data and make a presentation or publication, you are requested to include citation to the following article.
"Misumi, R., Y. Uji, Y. Tobo, K. Miura, J. Uetake, Y. Iwamoto, T. Maesaka, and K. Iwanami, 2018: Characteristics of Droplet Size Distributions in Low-Level Stratiform Clouds Observed from Tokyo Skytree. Journal of Meteorological Society of Japan, 96, https://doi.org/10.2151/jmsj.2018-040 ."
